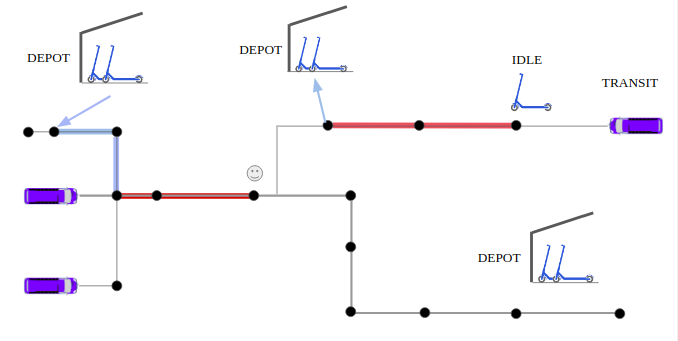
Optimization of Autonomous Drone Delivery Systems/shared electric scooter/Vehicle fleet operations has become essential for the fleet owners to increase their revenue. Ride revenue can be increased through the increase in the number of deliveries/rides per battery charge. One approach that is proposed in this project to achieve more scooter rides per charge is the concept of pig tailing. An autonomous Drone/Electric vehicle can use the transit networks to move to the location of its request. The agent can sit on the transit or get inside the transit to save battery and reach the destination safely.
Let the problem be formulated as follows:
Size of the Drone/scooter fleet = m
Number of depots = l with the geographical locations given as Vd:= {d1, d2, d3,...,dl}.
Number of ride requests = k from the geographical locations given as Vc:= {c1, c2, c3,...,ck}.
where k>>m.
Image shows the vertex set of the Allocation graph GA(vA, EA) which is VA = VD u VP.
For this project GBFS (General Bikeshare Feed Specification) dataset was used to know the station positions of the bikes and electric scooter in a small area in Washigton DC. Link to the GBFS website. The station .json consists of the information about the latitude and the loongitude of the bike stations. Transit Data can be extracted from the GTFS Dataset which provides the file with the route coordinates of a transit vehicle. These data files are very large and a lot of computer processing went into it. So for this project, a toy data was created for the transit network route for the purpose of demonstration. The map is generated using a shape file of the road networks in washington DC downloaded from the Washington DC open source datasets.
The image shown below is a plot for a small area in Washington DC. The red triangles represent the scooter depots, the yellow squares represent the ride requests. Here the number of depots is equal to 4 and the number of ride requests is equal to 15. In the implementation of the algorithm an allocation graph is required to be created. The allocation graph is created by calculating the distance between the depots and the ride requests locations. We exlude some of the edges if it is impossible to travel from d from p within half the allowed flight range. The black lines here shows an allocation graph.
The idea of implementing this paper for an electric scooter fleet did not go well. An electric scooter moves on the ground while a drone is an aerial vehicle. Thus finding the distance to perform optimization was difficult. Here I have calculated the euclidean distance which is a direct distance from the graph between point A and B without regarding the roads on the map. Thus, the implementation of the algorithm was is not complete.
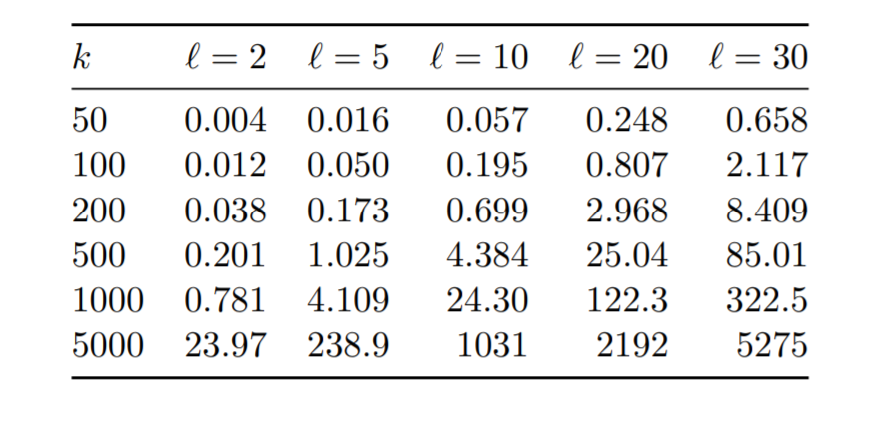
The results in the paper were generated by running simulations over two large scale public transit networks. The mean computation time for the algorithm over 100 different trials in different setting is shown and the implementation of the algorithms is also shown below. Here k represents the number of packages to be delivered and l represents the number of depots